


Oil Outlook for 2025
OPEC+, Iranian Sanctions, Chinese Demand, Peak Shale? & much more…

It is natural and necessary to have bullish and bearish market participants in order to achieve a balanced market environment. However, the current situation in the oil market is nothing but extraordinary. Bulls expect a balanced market with the potential for inventory draws while bears call for massive builds and a glut in the markets. The IEA is forecasting a massive inventory build of 950k b/d for next year while the EIA is calling for a small draw. This alone is a huge divergence. In addition, we have narratives surrounding OPEC+, Chinese oil demand, Iran, U.S. oil production, etc. This complexity coupled with a structurally bearish bias from Mainstream Media (MSM) has lead to narratives dictating the price of crude oil.
In this article we will break down OPEC‘s decision to extend production quotas, the Permian, Chinese demand, Geopolitics and my view on the market for 2025.
1.0| Structurally Pessimistic Forecasts & The Role of Mainstream Media
Narratives drive markets until day X comes. In the case of commodities it’s the day when you have supply shortages. Usually it doesn’t have to come this far for prices to react and naturally rebalance. When it comes to narratives and opinions, the oil market is as divided as ever. For investors/traders it’s best to cut out the noise and focus on facts. To understand what market participants are pricing in, we firstly have to look at their arguments. If you were to believe the IEA, we will see a surplus of ~ 950k b/d for 20251.
This assumption is so out of reality that one has to seriously question the sanity of this agency. We know that since OPEC banned many media outlets from their meetings, there has been a bearish bias by the MSM against oil. Prior forecasts by the IEA for large builds have proven to be nothing but hot air. Interestingly, the EIA has a different view for 2025. The organization expects a marginal draw of roughly 80k b/d. So what is driving this diverge? And most importantly, which kind of arguments are driving this divergence of views?
I would consider the following narratives as the key areas of debate:
OPEC is either going to flood the market or collapse.
Non-OPEC supply growth will more then offset demand growth.
China’s demand is going to disappoint massively due to a worsening of the economy.
Let’s break these ones down individually.
2.0| OPEC‘s Coordinated Actions
What is OPEC‘s goal? Which core believes do they have? These are the questions one has to ask himself if one wants to understand the organization’s actions. The fundamental goal is to create an environment of stable oil prices. An environment that allows for the prospering of its members and the global economy.
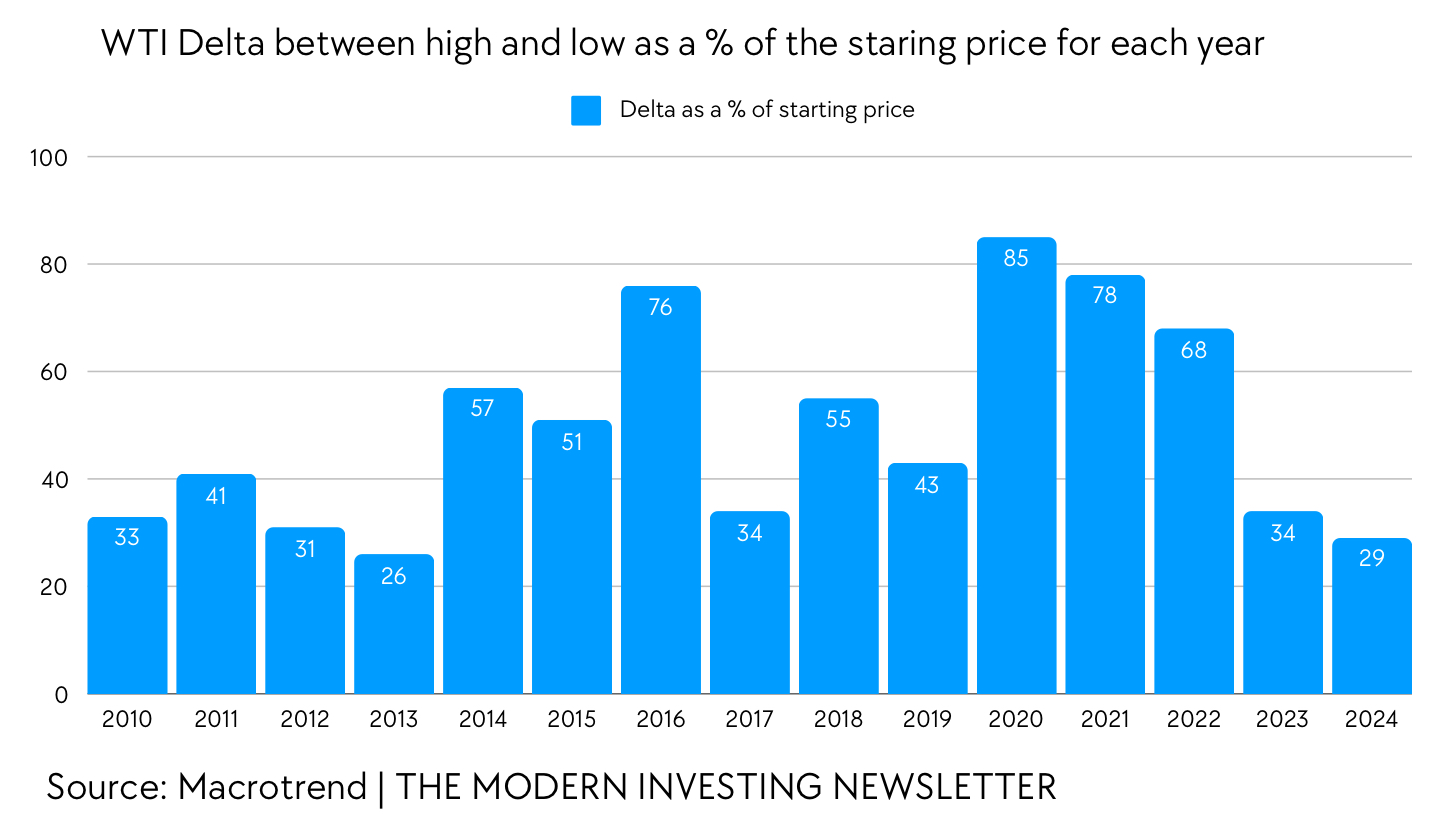
The chart below represents the delta between the high and low of WTI prices as a percentage of the yearly opening price. We can clearly see that volatility in oil prices has been declining post COVID. This is largely due to OPEC holding back barrels from the global markets, resulting in a more stable price regime.
2.1| OPEC‘s Big Mistake
Bears point out that OPEC‘s production cuts helped U.S. oil producers to hike their output at the expense of OPEC. Therefore a flooding of the market would be imminent to bankrupt the Shale/Permian. The issue with this scenario is that we already had this situation 10 years ago.
“OPEC members produced 36.5 million bpd of oil and natural gas liquids in 2014. When they met in November 2014, oil prices had already suffered a sharp fall from summer, but crude was still trading at ~$75/bbl. The world was probably oversupplied at that time by 1-2 million bpd, so if OPEC had merely decided to remove 2 million bpd off the world markets […] the price drop could have easily been arrested and maintained in the $75-$85/bbl range.
Would that strategy have cost them market share? Sure, a small amount. But assume they then pumped 34.5 million bpd at $80/bbl. That's just over a trillion dollars in annual revenue. If instead they pump 36.5 million bpd at $35/bbl […] that's $466 billion in annual revenues. The annual difference in those scenarios is $541 billion. OPEC already lost out on that much in 2015 from the sharp drop in prices.”2
— OPEC‘s Trillion-Dollar Miscalculation; Forbes
Back then OPEC was ready to accept short/medium term pain in exchange for long term dominance over the global energy markets. Their strategy was to flood the market in hopes of non-OPEC supply dropping substantially. This plan backfired greatly as U.S. oil production turned out to be more resilient than previously anticipated. The resulting collapse of crude prices would cost OPEC hundreds of billions of dollars over the coming years. Over the past 2 years, OPEC+ took a different approach. While we were in a somewhat similar situation as in 2014, OPEC+ seemed to have learned a lesson from its previous mistake. The group agreed to cut production by a total 5.86 mmb/d to stabilize the markets.
2.2| Prioritizing Stability Over Market Share
Recently, during the December meeting, OPEC+ made it crystal clear that the group would not flood the market, but rather take an approach that focuses on the gradual return of barrels into the market. This strategy prioritizes stability and will increase the group’s market share slowly over the coming two years. The plan outlined by OPEC+ extends production cuts by three months till end of March 2025 and extends the period till the cuts are added back till end of 2026. This will lead to a reduction in barrels that will be added back per month compared to the previous scheduled from 180k b/d to 138k b/d.
The following chart shows the cumulative amount of returned barrel by OPEC+ in 2025 under the previous and revised schedule.
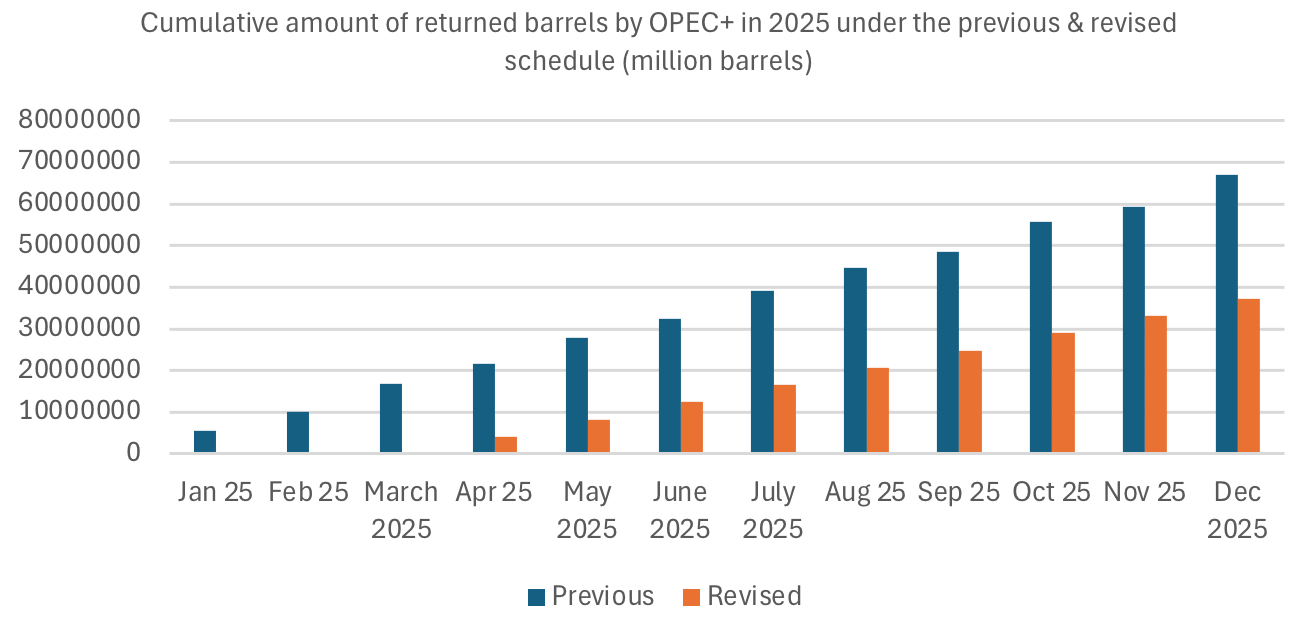
The difference between the previous and revised schedule is a cumulative 300 million barrels. The revision of OPEC+‘s schedule will effectively lead to a decrease in supply growth of ~840k b/d for the entire year of 2025.
This decision is a strong sign of OPEC+‘s commitment to stabilize the global energy markets. One of the key points from the meeting was that the UAE agreed to push back the gradual production increase by three months and extend the time to reverse the cuts from nine months to eighteen months. This will put the UAE in the same position as other member countries, which is remarkable considering that the UAE would get a “special treatment“ until not long ago. In June of 2024 for example, OPEC+ agreed to prolong the production quotas, the only exception were the UAE, which were allowed to gradually increase output by 300k b/d.3
2.3| Well Coordinated Actions & Unity Among The Members
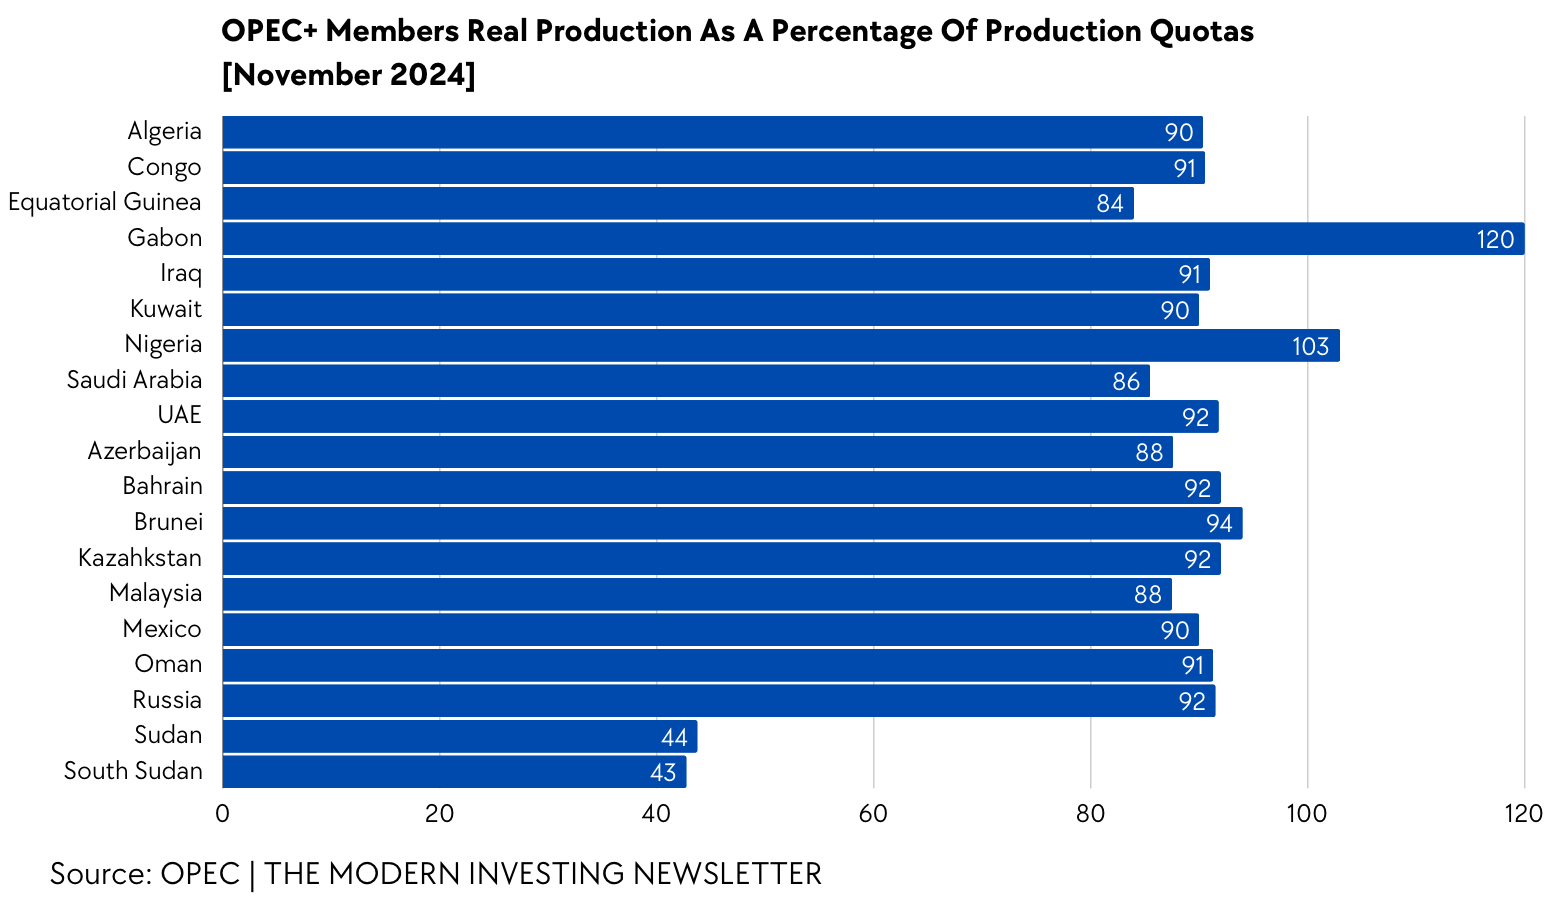
OPEC+ has managed the global oil markets in a well coordinated manner over the past 2 years. The recent December meeting has only emphasized the group’s united stance. The „cheaters“ (e.g. Kazakhstan, Iraq and Russia) have started to comply to production quotas after pressure from Saudi Arabia. While one can never be sure how long these countries will stick to their promises, it’s a first positive sign. In November of 2024, most OPEC+ members are producing below quotas.4 5
There are many narratives and opinions surrounding OPEC+, but this is my simple view. The group has learned from its previous mistake and has adopted a more stable strategy that aims to gradually gain market share as demand continues to grow and non-OPEC supply fails to grow as fast as previously anticipated (especially the U.S, but more on this later). Some market participants view the group as a failed organization but in my view their coordinated actions to stabilize the global energy markets are greatly under-appreciated. If the group’s plan to gradually gain market share without a significant drop in oil prices pays off, we could say that OPEC+ has worked perfectly together to achieve their goal. Something that seemed very difficult considering differences between the members.
3.0| Non-OPEC Supply Growth
The second major narrative causing a divide between market participants is the topic of non-OPEC supply growth, especially U.S. production growth. The peak of the Shale has been predicted countless times over the past years. Spectacular growth over the past years has led the IEA and other forecasters to assume significant growth in U.S. oil production in 2025, something that we should at least question.
3.1| U.S. Oil Production
The chart below shows U.S. crude oil production, as reported by the EIA6, every month from January 2018 till September 2024.
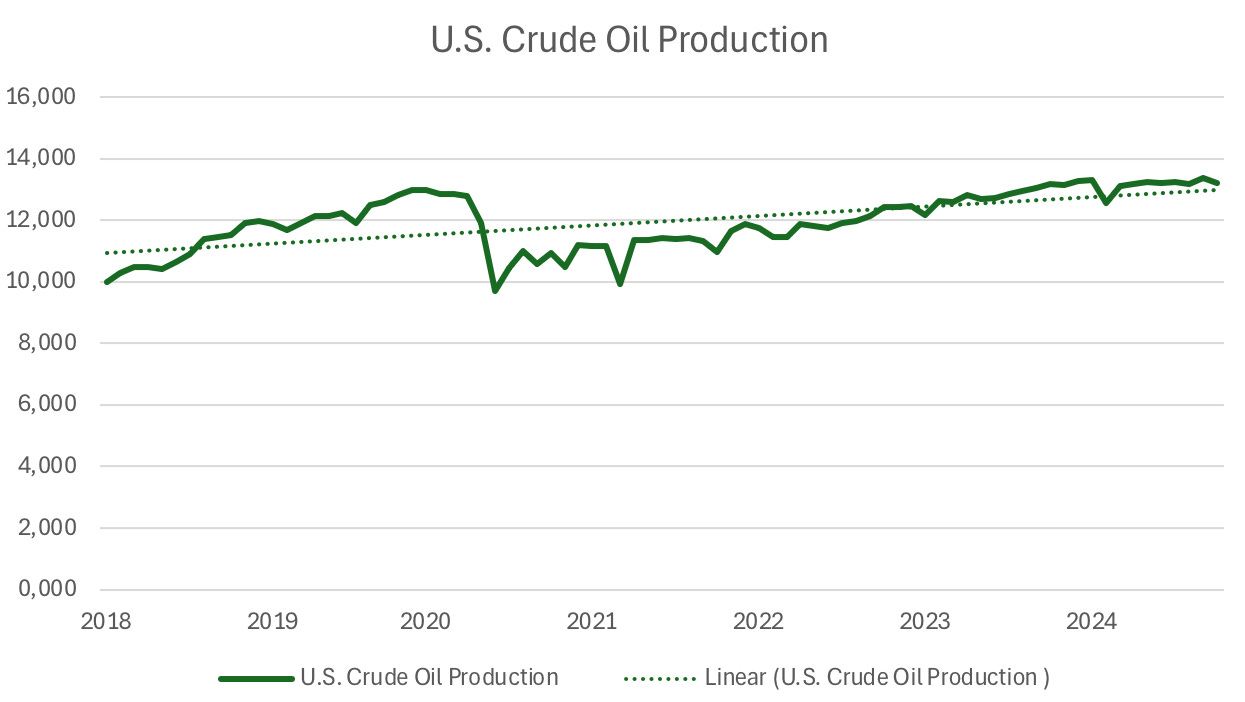
We can clearly see that production has been more or less flat the past year following significant growth post COVID. YTD (Year To Date) production growth stands at 300k b/d compared to the same period of 2023. The growth rate between 2022 and 2023 was nearly 1 mmb/d showing clearly how growth has deteriorated over the past year. With the drop in oil prices during the budgeting season, many producers have scaled back prior CAPEX forecasts (e.g. Chevron, Exxon, etc.).
In addition, gas production growth is outpacing crude production growth, leading to a higher GOR (Gas to Oil Ratio). This is a trend that is worth following, as the new treasury secretary Scott Bessent has publicly stated that he wants to grow U.S. oil production by 3 mmboe/d. The important thing is that 3 mmboe/d (million barrels of oil equivalent per day) isn’t the same as 3 mmb/d (million barrels per day). Over the past 9 years, 41% of U.S. production growth came from natural gas, 28% from natural gas liquids (NGLs) and just 28% from crude oil.7
“Natural gas comprised 40% of total production from the Bakken, the Eagle Ford, and the Permian compared with 29% in 2014.”8
— EIA
Rising gas production signals a plateauing Shale and aging wells. In the future, growth, if expressed in boe is probably 40-50% natural gas.

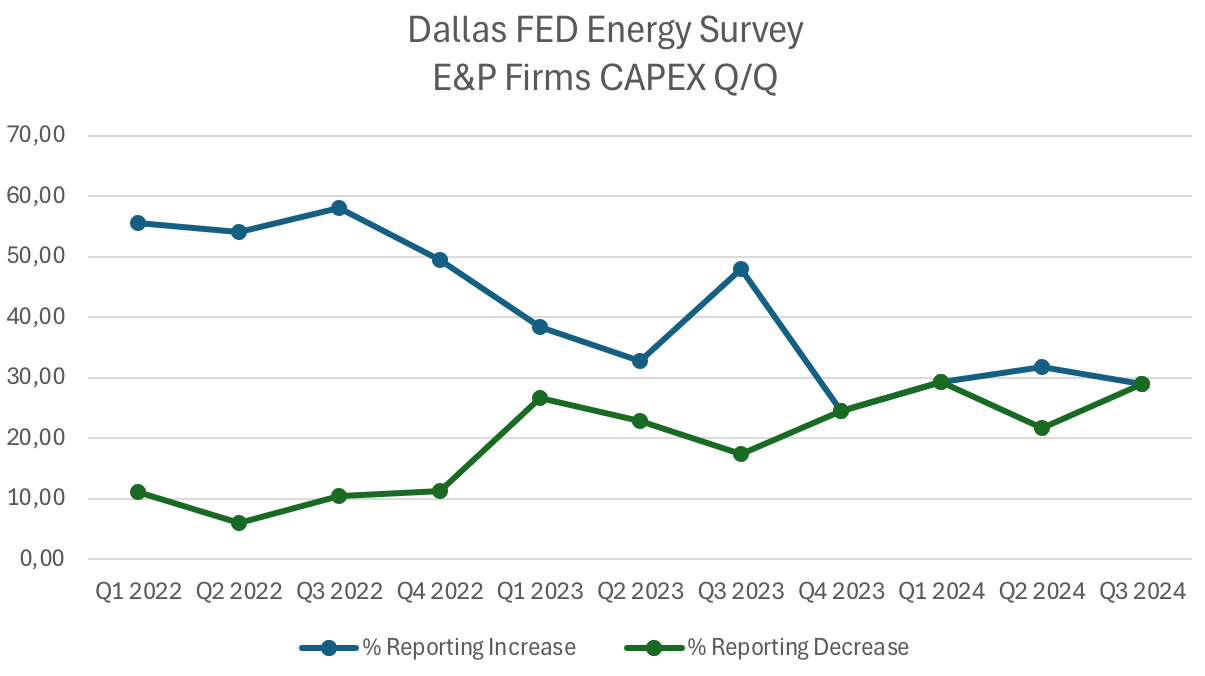
As can be seen in the graphic above, gas-to-oil ratios have risen considerably over the past decade. Exxon’s Upstream President recently said that U.S. oil and gas production will not grow significantly over the coming years9. Under the coming Trump administration we will definitely see pro fossil fuel policies and deregulation. But will this be enough? There is reason to doubt that. If we think of a hierarchy of things that influence the production levels in the future, politics is 3rd after geology and the market environment. Current prices (market environment) don’t support growth, as breakevens for newly drilled wells hover between $59-70 a barrel up 20-30% from the $48-54 range in 2019.10

The drop of prices to the $65-70 area has led companies to more frequently report a decrease in CAPEX as in prior quarters.11
Chevron might be one of the best examples, as the major has cut back on CAPEX to prioritize FCF over production growth.12 We know that the Shale has massive decline rates by design. New wells start of strong but quickly decline 30-40% over a singe year. If reinvestment drops, one can’t assume production to be unaffected. The rig count has traditionally been used as an indicator for production as fewer rigs equal lower production, right? Wrong! Efficiency has been a core driver of the boom in U.S. oil production. Productivity per acre has grown significantly in the past few years. This, however, is something that could change with the rapid decrease in Tier 1 inventory. When Exxon acquired Pioneer Natural Resources in 2023, the key reason behind it was the large undeveloped Tier 1 inventory the company had.
High quality inventories are scarce and their value in M&A transactions has been astronomically high in recent deals.
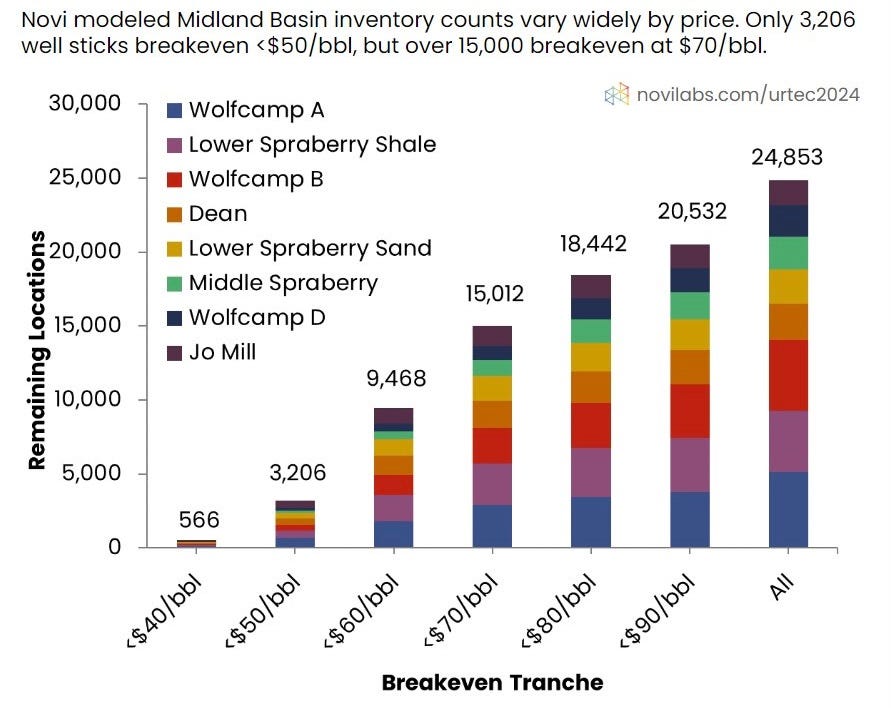
“Shale is not a uniform resource. Despite impressive advances in productivity over the past decade, rock quality remains the most important driver of well performance. […]
Less than two-fifths of the 25,000 drilling sites estimated to remain in the Midland basin offer a breakeven below $60/bbl over a two-year period […].”13
— Argus Media
Based on NoviLabs‘s study,14 most of the low breakeven inventory is already drilled down, leaving remaining drilling locations with breakevens around the $70/bbl mark.
With cost inflation along the entire value chain and a deterioration of Tier 1 inventory, productivity per well is set to face headwinds would prices stay at current levels. That said, U.S. production won’t fall off a cliff. It could grow in 2025. But in order to have significant growth, as projected by many analysts, the market environment (mainly prices) would have to change.
3.2| Canada & South America
Canada, along Guyana and Argentina are probably the most predictable non-OPEC nations in terms of oil supply growth in 2025. With good breakevens and companies willing to drill, these countries are projected to grow production by ~580k boe/d in 2025 with the majority of this growth (380k boe/d) coming from Canada.
Brazil is expected to grow by ~180k boe/d, but recent performance was below prior forecasts, indicating potential struggles in meeting this goal.

3.3| Summary Of Non-OPEC Supply Growth
With the U.S. probably underperforming estimates and issues in Brazil, one has to wonder what global inventory balances might look like would non-OPEC supply growth come in lower then anticipated. Currently the EIA (more credible than the IEA) projects a draw of 80k b/d for the year 2025 with non-OPEC supply growth of 1.5 mmb/d. The U.S. is projected to grow by 430k b/d, which could be to high considering the the current price of WTI. If non-OPEC supply growth would be 1.38 mmb/d inventories would build by 200k b/d (if everything else stays the same). So in terms of non-OPEC supply growth, a lot has to go perfect for production growth to live up to its expectations.
4.0| China And Global Demand
The focus in 2025 will definitely come down to supply; however, we also have some interesting observations in terms of demand. What region globally will experience higher growth? OECD countries or non-OECD ones? Obviously it will be non-OECD countries. Of the expected 1.3 mmb/d demand growth, 93% is projected to come from non-OECD nations, with China and other non-OECD countries in Asia accounting for 790k b/d of growth.15 The biggest growth driver being India, with projected demand growth of 330,000 b/d in 2025 up from 220,000 b/d of growth in 2024.16 The forecasts for global demand growth range from 1.1 mmb/d from the IEA to 1.4 mmb/d from OPEC. In its December report the IEA raised its global oil demand growth forecast for 2025 by 110k b/d to 1.1 mmb/d.17
In an article by Vitol on China’s medium term oil demand outlook18, Giovanni Serio laid out why Chinese demand will grow further driven by petrochemicals rather than transportation.

Headlines in newspapers and the media constantly promote the narrative of peak Chinese oil demand. The focus is always on EVs, which already account for 50% of car sales. This obviously has a negative impact on gasoline demand, which is the reason why agencies like the IEA have very bearish forecasts on Chinese oil demand. The problem is, that one has to look not only at gasoline demand. Global oil demand growth will almost entirely derive from jet fuel and naphtha, while gasoline is projected to decline starting in the late 2020s.

The story for petrochemicals is clear, demand for plastics, pharmaceuticals, packaging and cosmetics will continue to grow, leading to quickly rising demand. So what about gasoline? ICEs (Internal Combustion Engine Vehicle) account for 84% of the passenger car fleet as of 2024. By 2030 this number is projected to drop to 70% (right chart).19
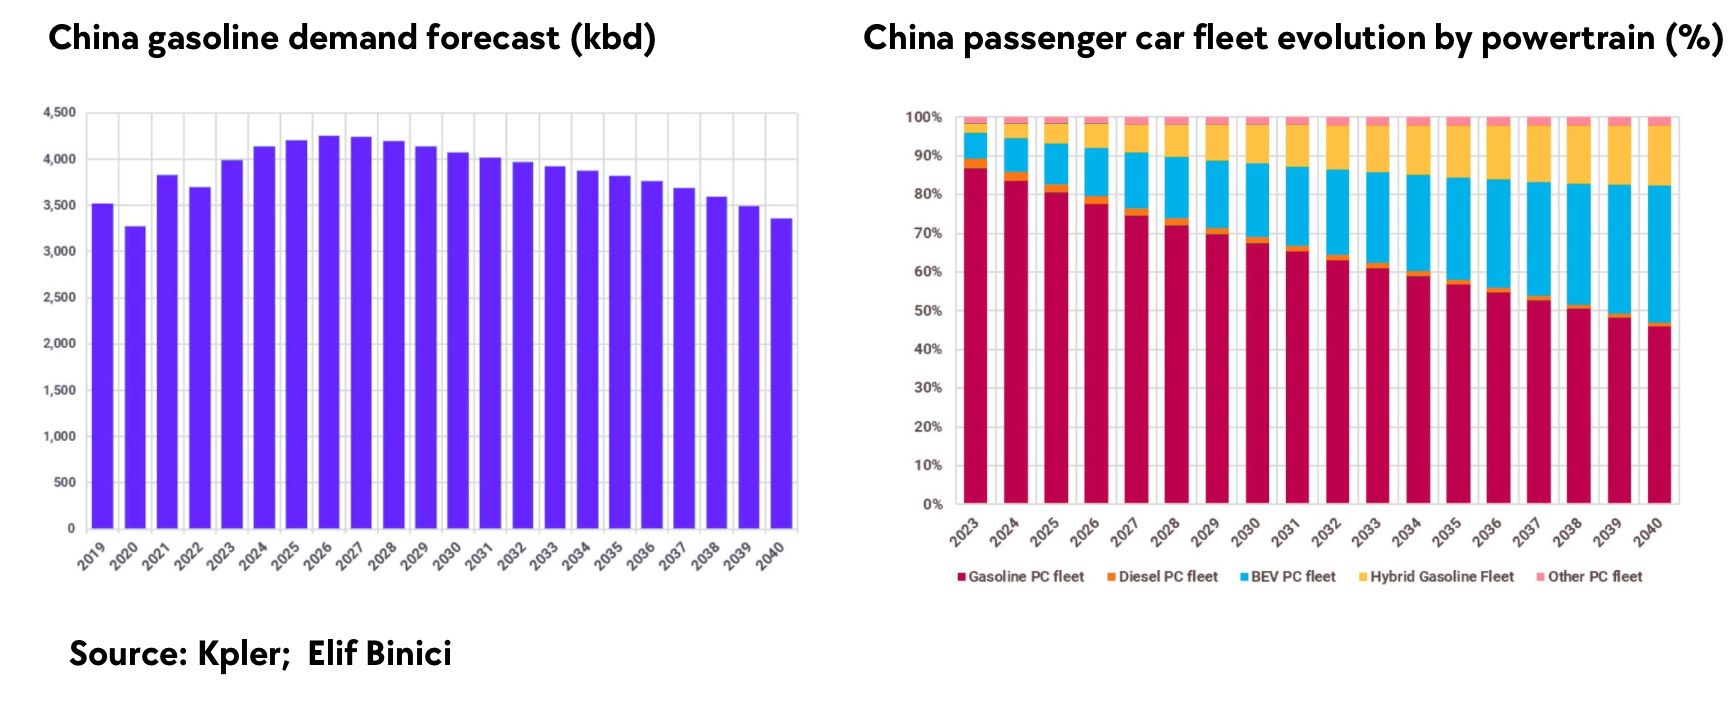
BEVs (Battery Electric Vehicles) and PHEVs (Plug-in Hybrid Electric Vehicles) are expected to grow materially, the question however will be, how much percent of the total fleet PHEVs will occupy. As PHEVs still consume some portion of gasoline, the adaption of them over BEVs is better for overall gasoline demand. If we look at the latest numbers of BYD, the largest producer of EVs globally, BEVs accounted for 40% of their sales, while PHEVs accounted for 60%.
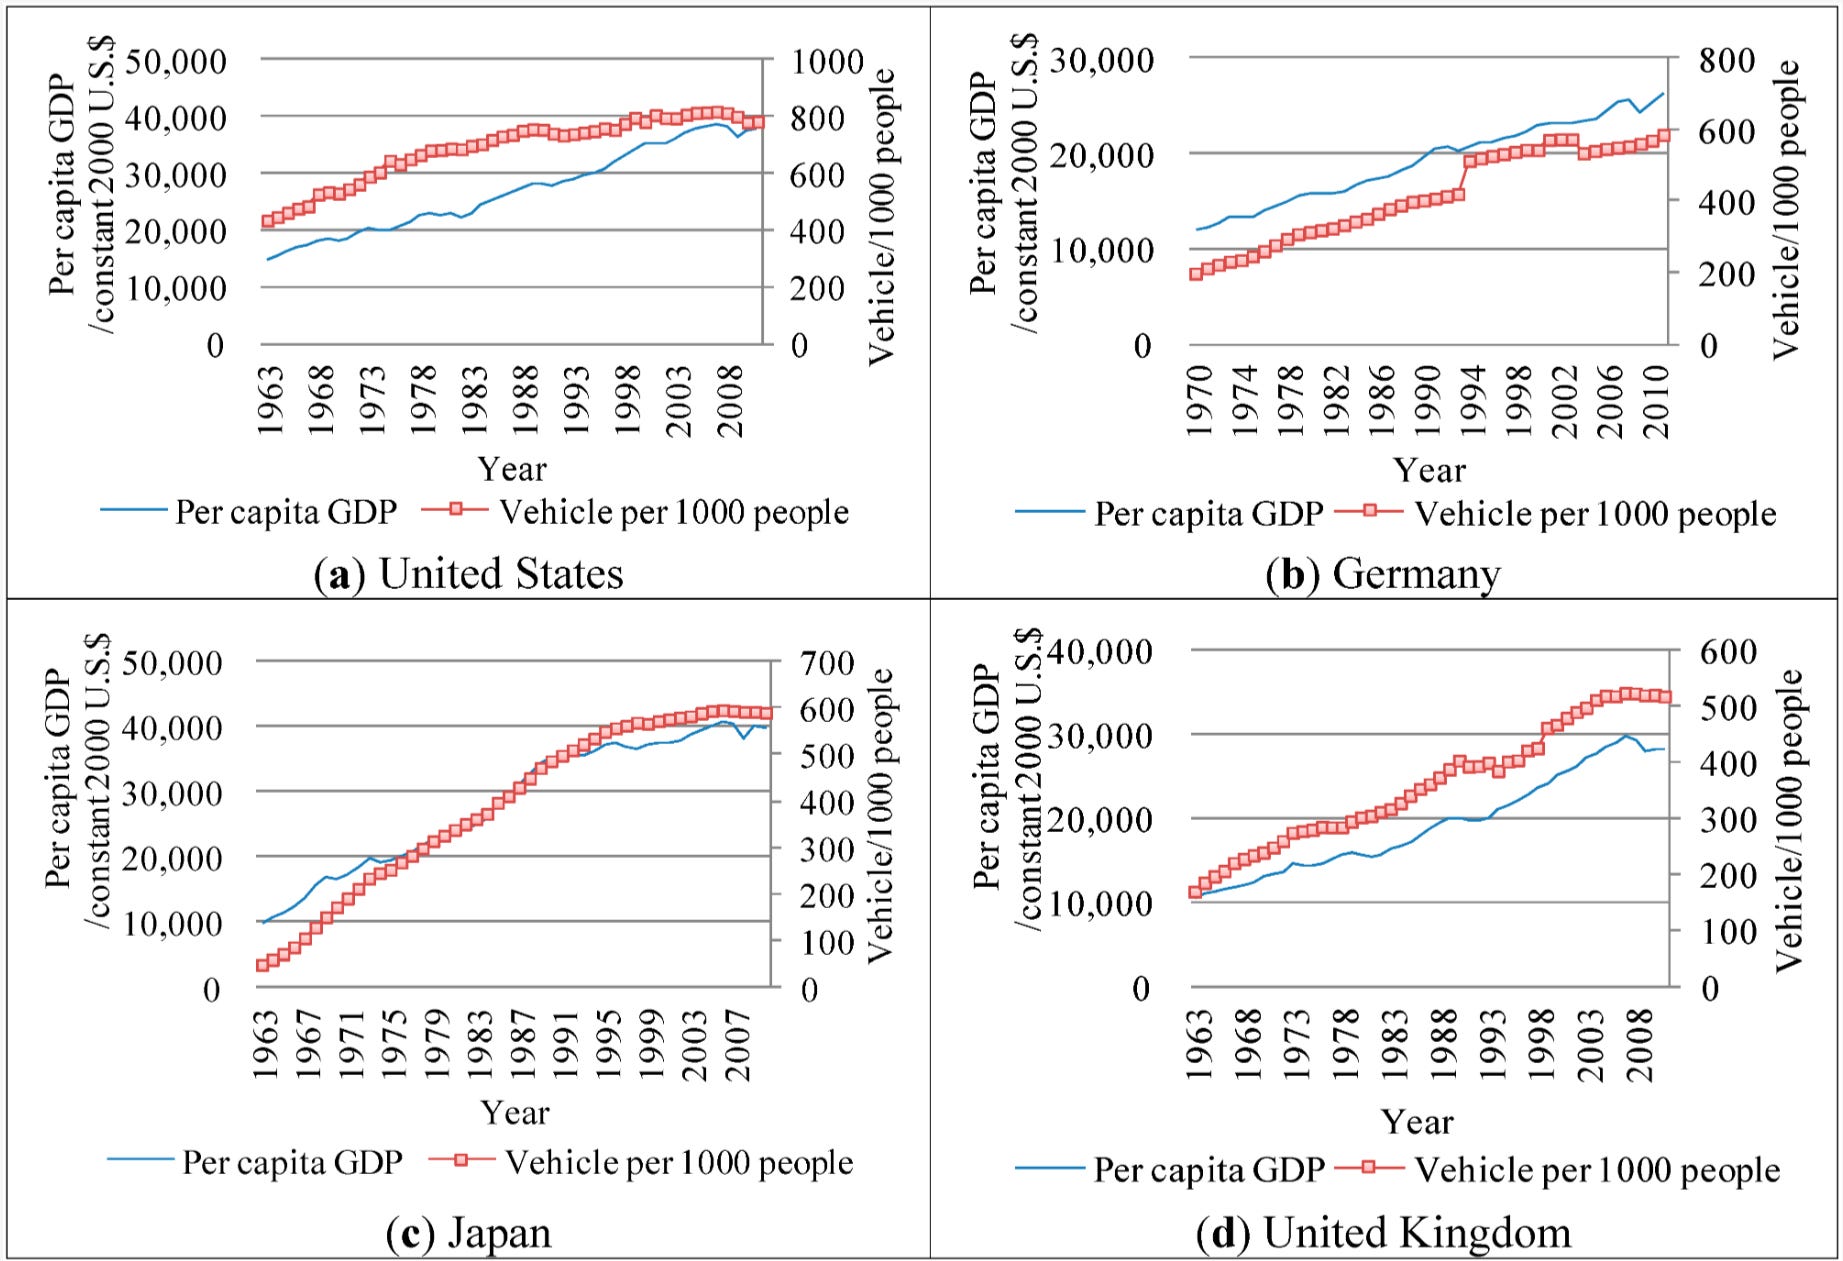
Chinese gasoline demand is projected experience gradual growth until reaching a plateau in 2026. The reason for this lies in overall growth of the Chinese car fleet. If we look at the amount of cars per thousand people, China stands at just 223 as of 2024. As the Chinese economy will continue to grow and the Chinese Middle Class will hit nearly 800 million people by 203520, the number of cars per capita should continue to come closer to that of developed nations. The graphs below21 clearly emphasize the correlation between the GDP per capita and the car ownership rate, with the examples of the U.S, Germany, Japan and the United Kingdom.
An important aspect that will get more attention under the Trump administration will be Chinese car exports. As the country is electrifying a larger share of its vehicle fleet, China will export many ICEs into the rest of the world. This is a process that began after the pandemic. In 2021 China exported ~1 million cars, with ICEs accounting for nearly all of it. In 2024, China will export ~4.5 million cars, with ICEs accounting for 3.1 million of it.22 This is crucial for global energy markets because many people in countries like Indonesia and India, who would never have been able to afford a car, now have the opportunity to own a cheap ICE from China.
Recent demand weakness in China can be linked to a struggling construction and real estate sector. However, with stimulus announcements and statements from Chinese policymakers, 2025 is expected to see stronger demand than 2024. While the market environment isn’t perfect and the real estate sector still faces challenges, it’s not facing the total collapse that many predict. The Chinese economy is shifting from heavy industries to tech, clean technologies, and other sectors. Stimulus measures and lower interest rates give hope for a better economic outlook in 2025.
5.0| Iranian Sanctions
Among the main topics in the U.S. presidential elections were geopolitics, particularly the Ukraine/Russia and Israel/Gaza conflicts. With Donald J. Trump’s victory, the U.S. will continue to support Israel through financial and military aid. Trump has also stated that he will impose heavy sanctions on Iran to cripple its economy. Given his support for Israel’s desire to strike Iran’s nuclear program, it’s likely he will continue backing Israel. Under the Biden/Harris administration, Iranian oil exports have increased to 1.8 mmb/d, with China being the main buyer.
The main goal of sanctions is to hurt Iran so severely that it can no longer arm proxies in Lebanon, Yemen, etc. Israel sees an opportunity to shift the balance of power in the region and would like to destroy Iran’s nuclear capabilities. This is nothing new, as Israel and Iran have been engaged in a tit-for-tat conflict in recent months, with attacks on each other becoming increasingly violent.
“We need to go for the head [of the snake], for Iran — if we only hit the Houthis, it’s not certain we’ll manage to stop them.”23
— David Barnea, Chief of Mossad
Recent developments in Iran have exposed the failure to meet gas requirements as old infrastructure, Israeli attacks and corruption have lead to a gas shortage of unparalleled proportions.
“We are facing very dire imbalances in gas, electricity, energy, water, money and environment”. “All of them are at a level that could turn into a crisis.”24
— Masoud Pezeshkian, Iranian President
Half of Iran’s manufacturing sector has shut down, and many schools and government institutions have closed due to the gas crisis. These challenges are compounded by a recent slowdown in Iran’s crude exports to China. The drop was largely due to Chinese buyers being more cautious ahead of Trump’s inauguration. Kpler reported that oil shipments to China fell by about 500k b/d in November compared to the previous month25. Iranian officials have responded by denying these claims.
"This is part of the enemies' psychological warfare. We have no problems with selling oil."26
— Mohsen Paknejad, Iranian Oil Minister
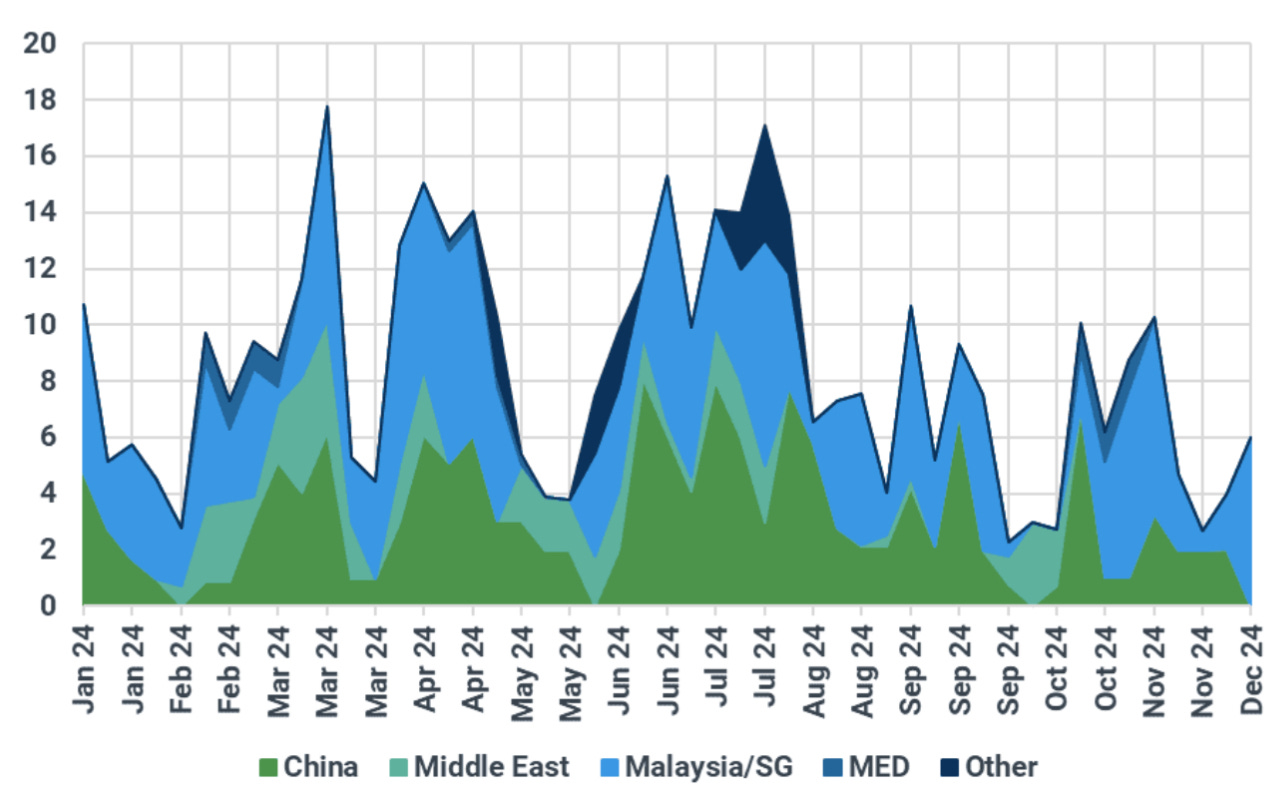
In terms of sanctions, Trump is expected to apply "maximum pressure" on the country. Already ahead of his inauguration the U.S. sanctioned more tankers involved in smuggling oil from Iran to China via Malaysia and Singapore. As a result of lower imports from China, Iranian floating oil storage has increased especially in Malaysia and Singapore.
It remains to be seen how impactful the new sanctions will be and the extent to which Trump can impose "maximum pressure" on Tehran. It is believed that Trump will not only sanction individual tankers but also threaten key financial institutions, oil terminals, terminal operators, and refineries27. The most important player on the other side is China, whose refiners have been buying Russian and Iranian crude on the cheap for the past years. Due to concerns of persistent lower oil supply from Iran, Chinese refiners have begun to source more crude from Saudi Arabia.
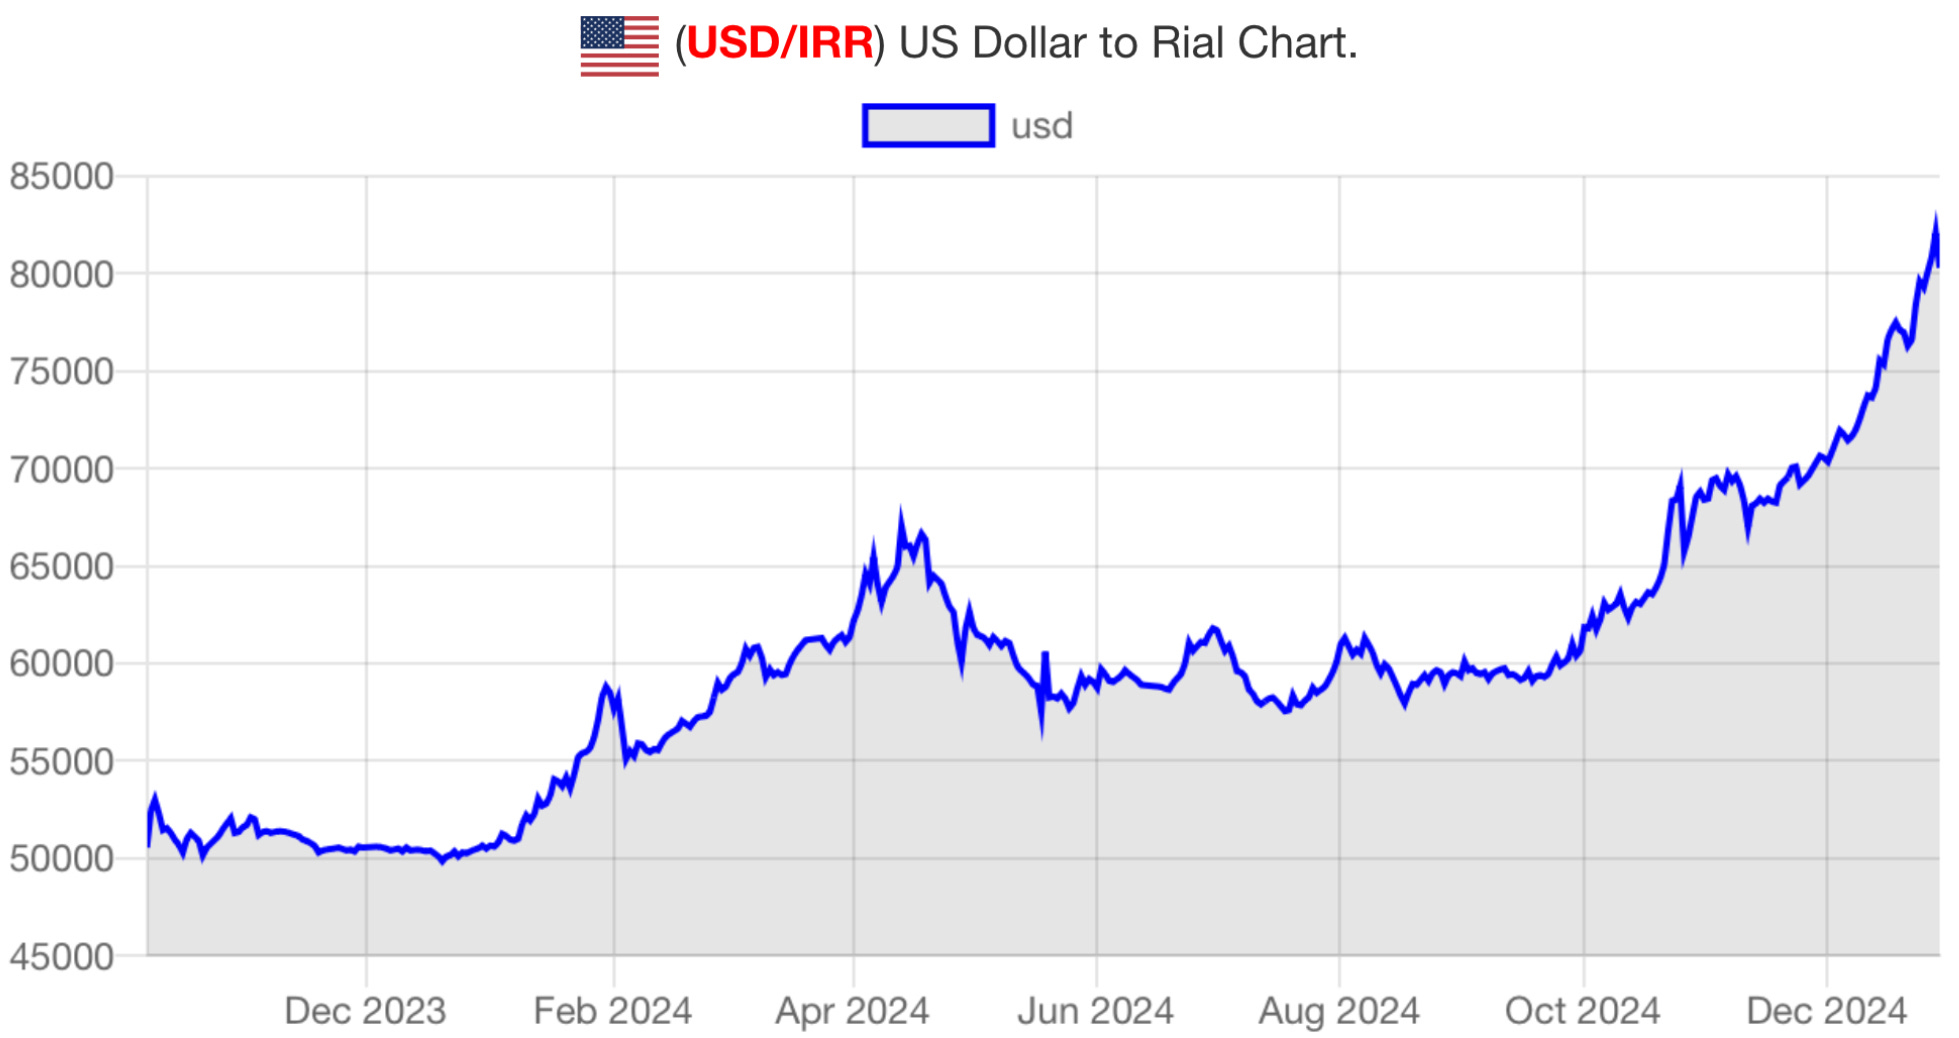
The Iranian economy has been hit hard by inflation, the gas crisis and the conflict with Israel. This can be seen when one looks at the black market exchange rate of the Iranian Rial (IRR) vs. the U.S. dollar. The IRR has been hitting new all time lows and has depreciated by a staggering 38% since October 7th 2023.
We can assume that Trump will threaten China with a second trade war if they continue supporting Iran as much as they do right now. This could take either turn, but it is expected that China would agree to some kind of a deal if a trade war is at risk of happening. For now, we have to wait and closely monitor developments in Iran before we can make predictions.
6.0| What Are The Markets Telling Us?
When I ask what the markets are telling us, I mean the physical market. Mainly time spreads and inventories. Market movements in recent times seem detached from fundamentals, likely due to the influence of quant funds and algorithms. Below we can see global inventories since 2017. Currently we can see counter-seasonal draws with inventories at multi-year lows.
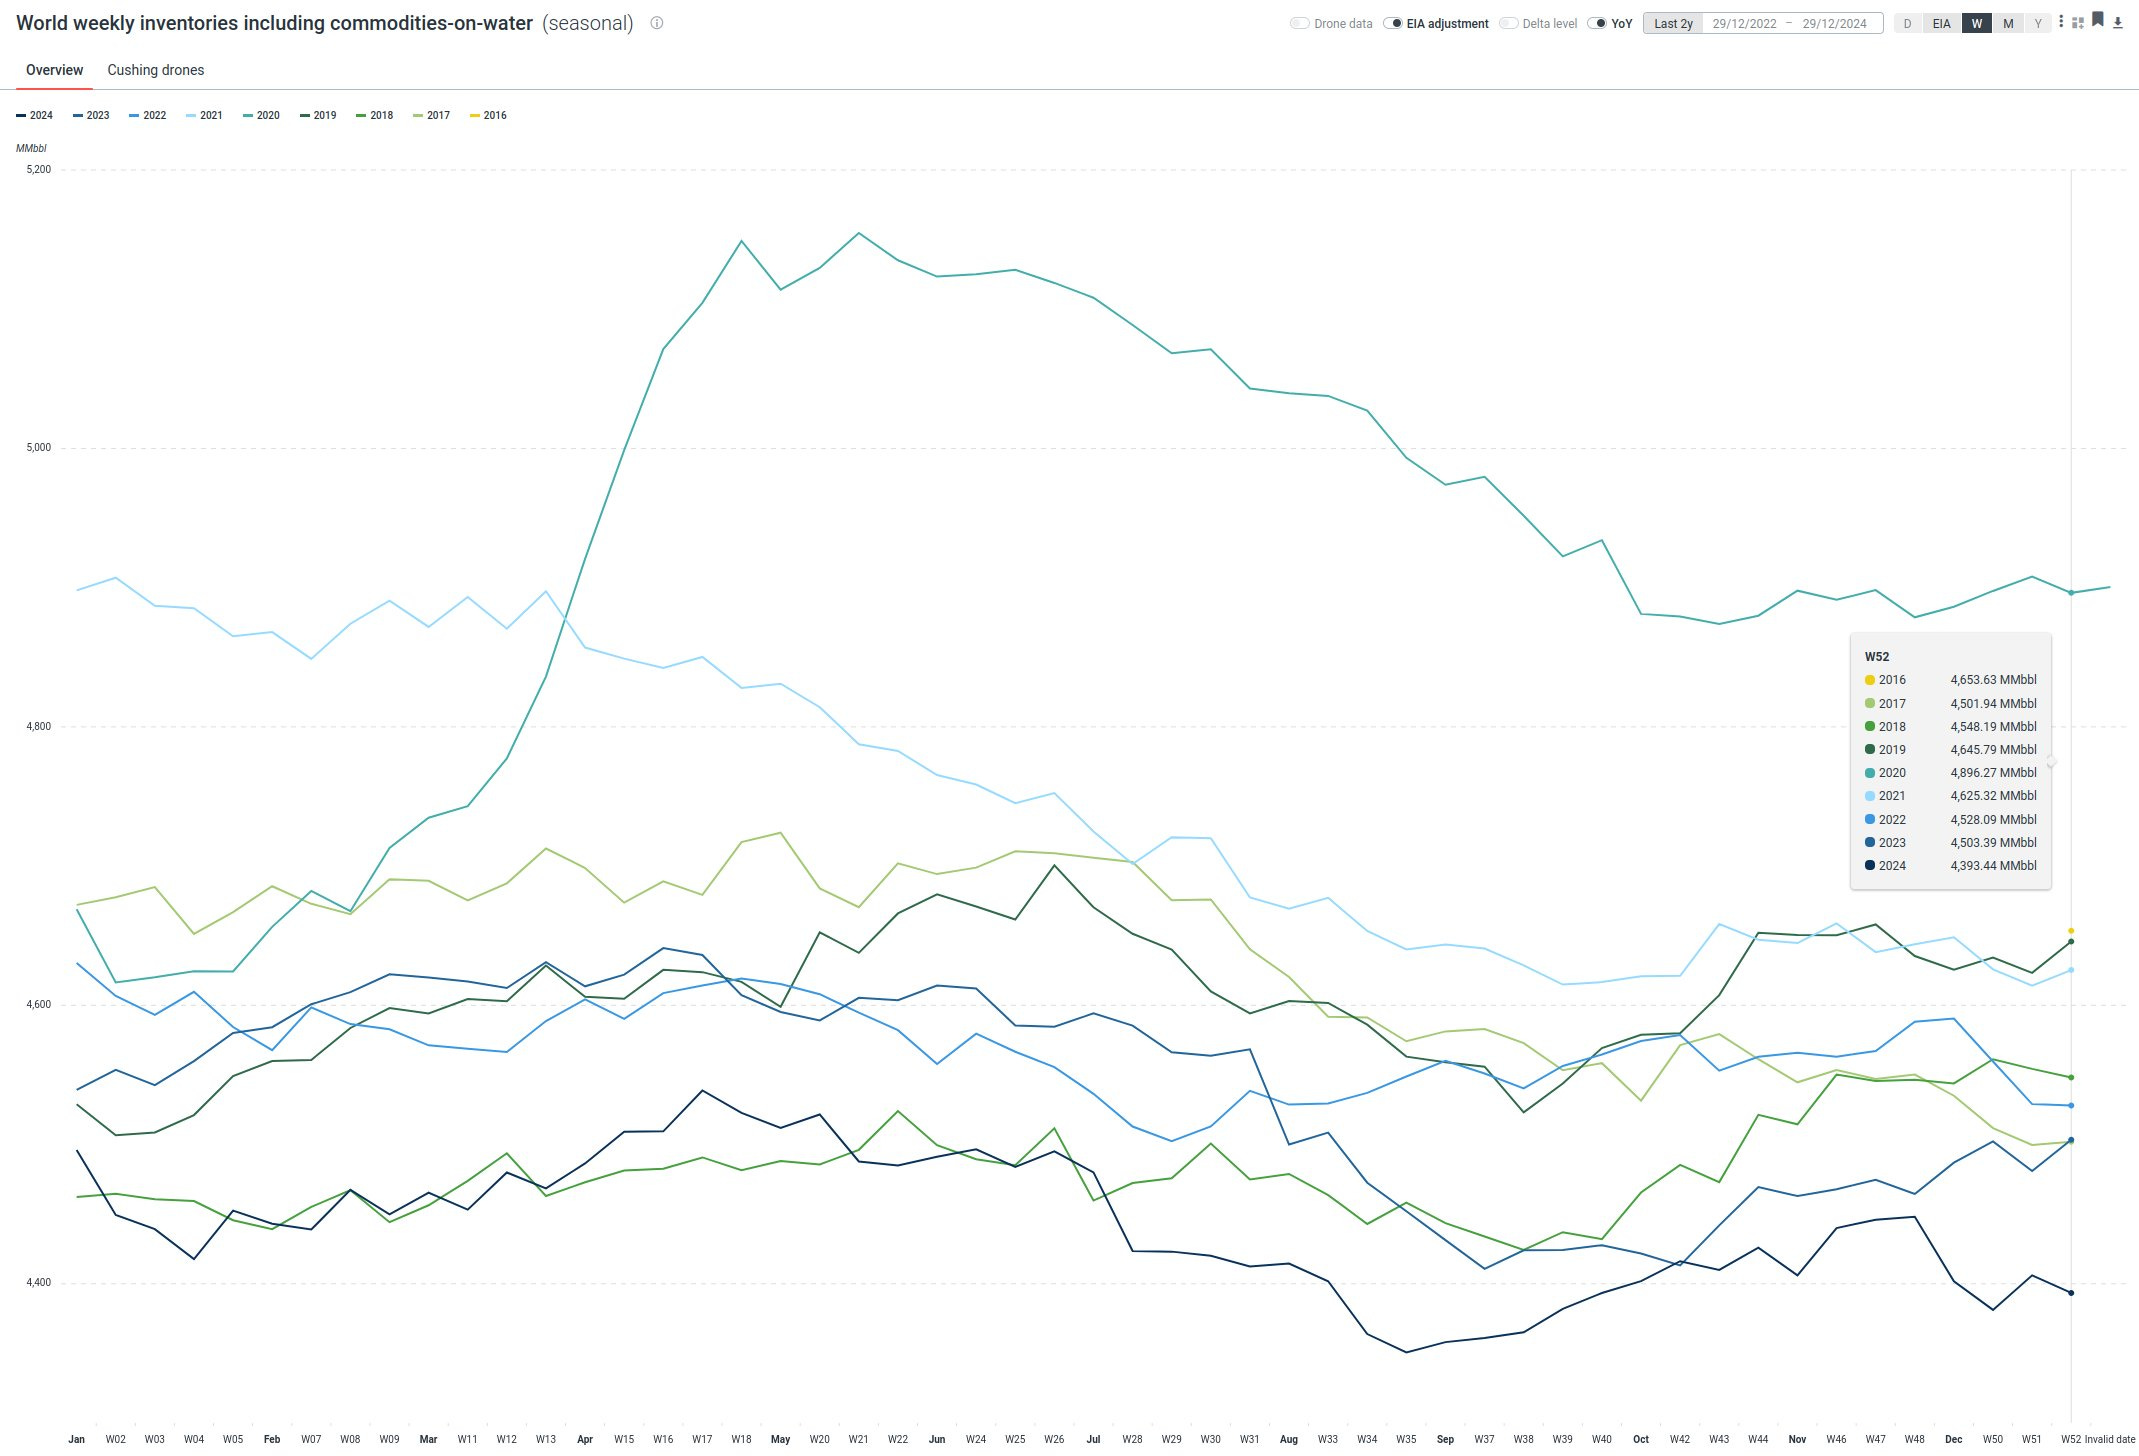
Low inventories reflect the current supply-demand balance. With headlines of a looming oil glut, the move in inventories has clearly been against consensus. More importantly, time spreads are showing no signs of a looming oversupply. Below we can see time spreads for Brent and WTI.
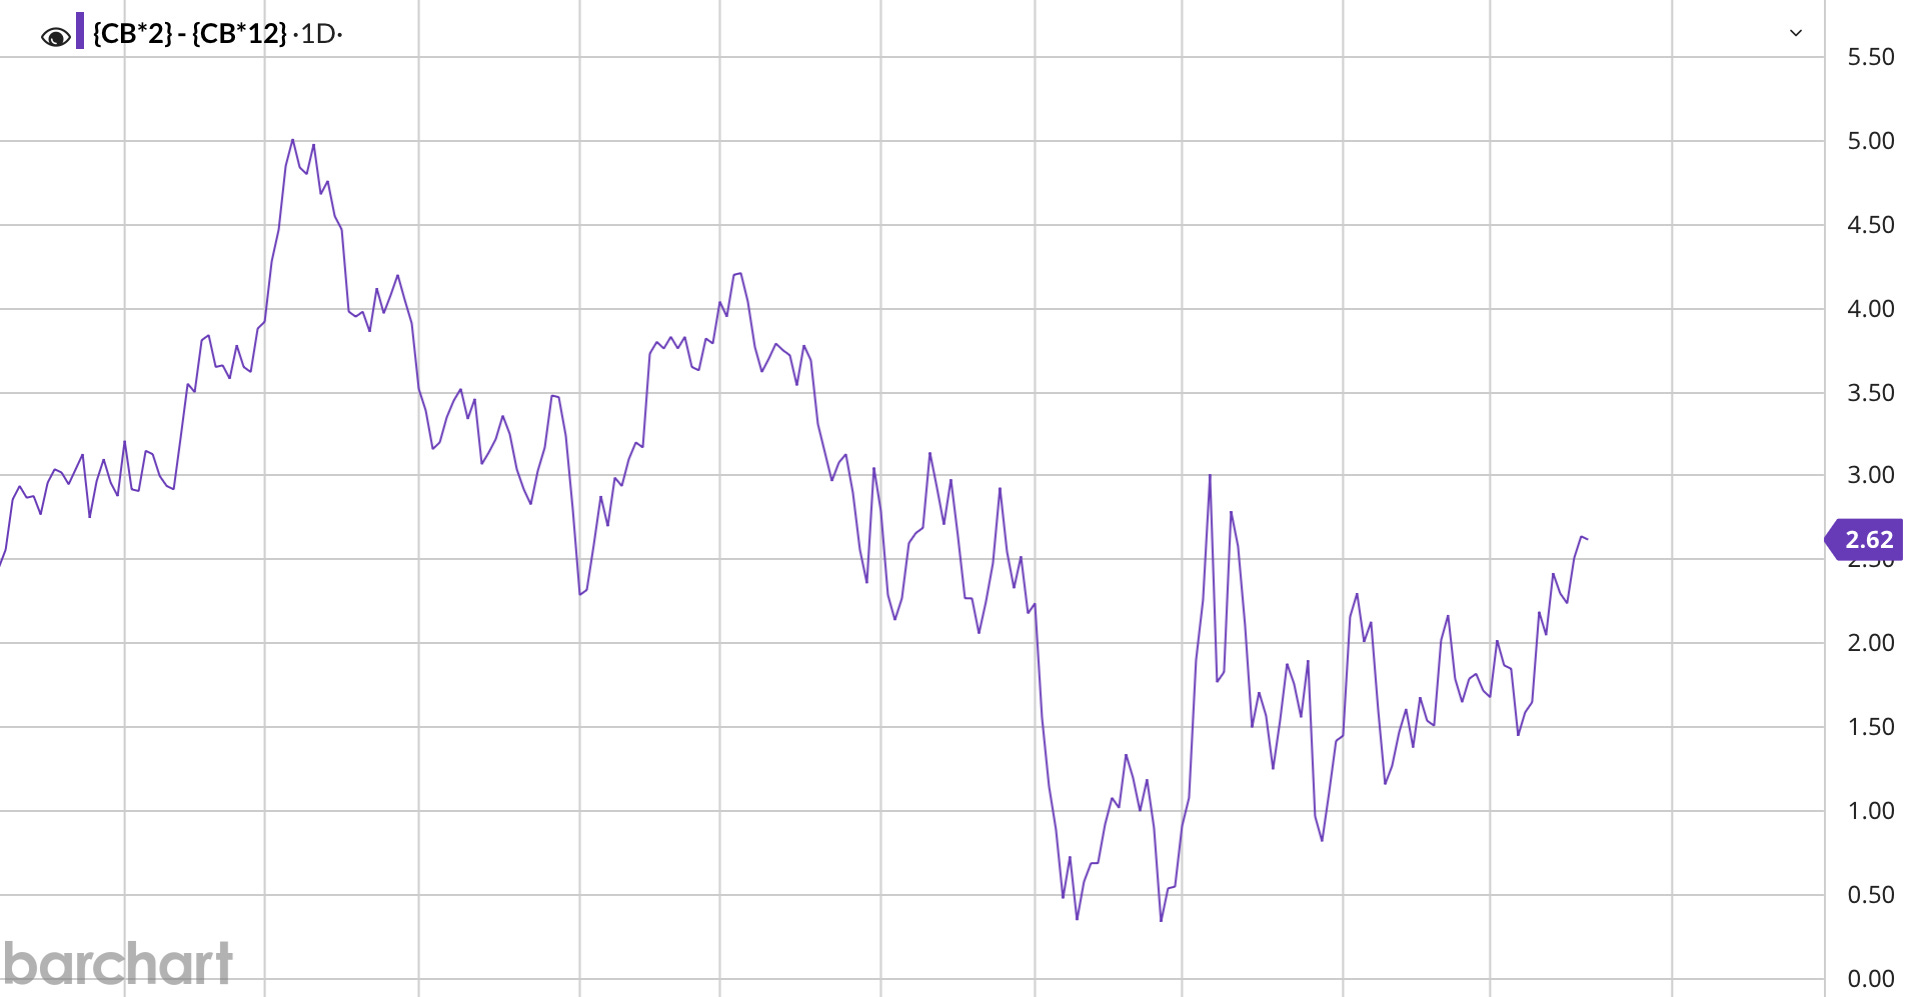
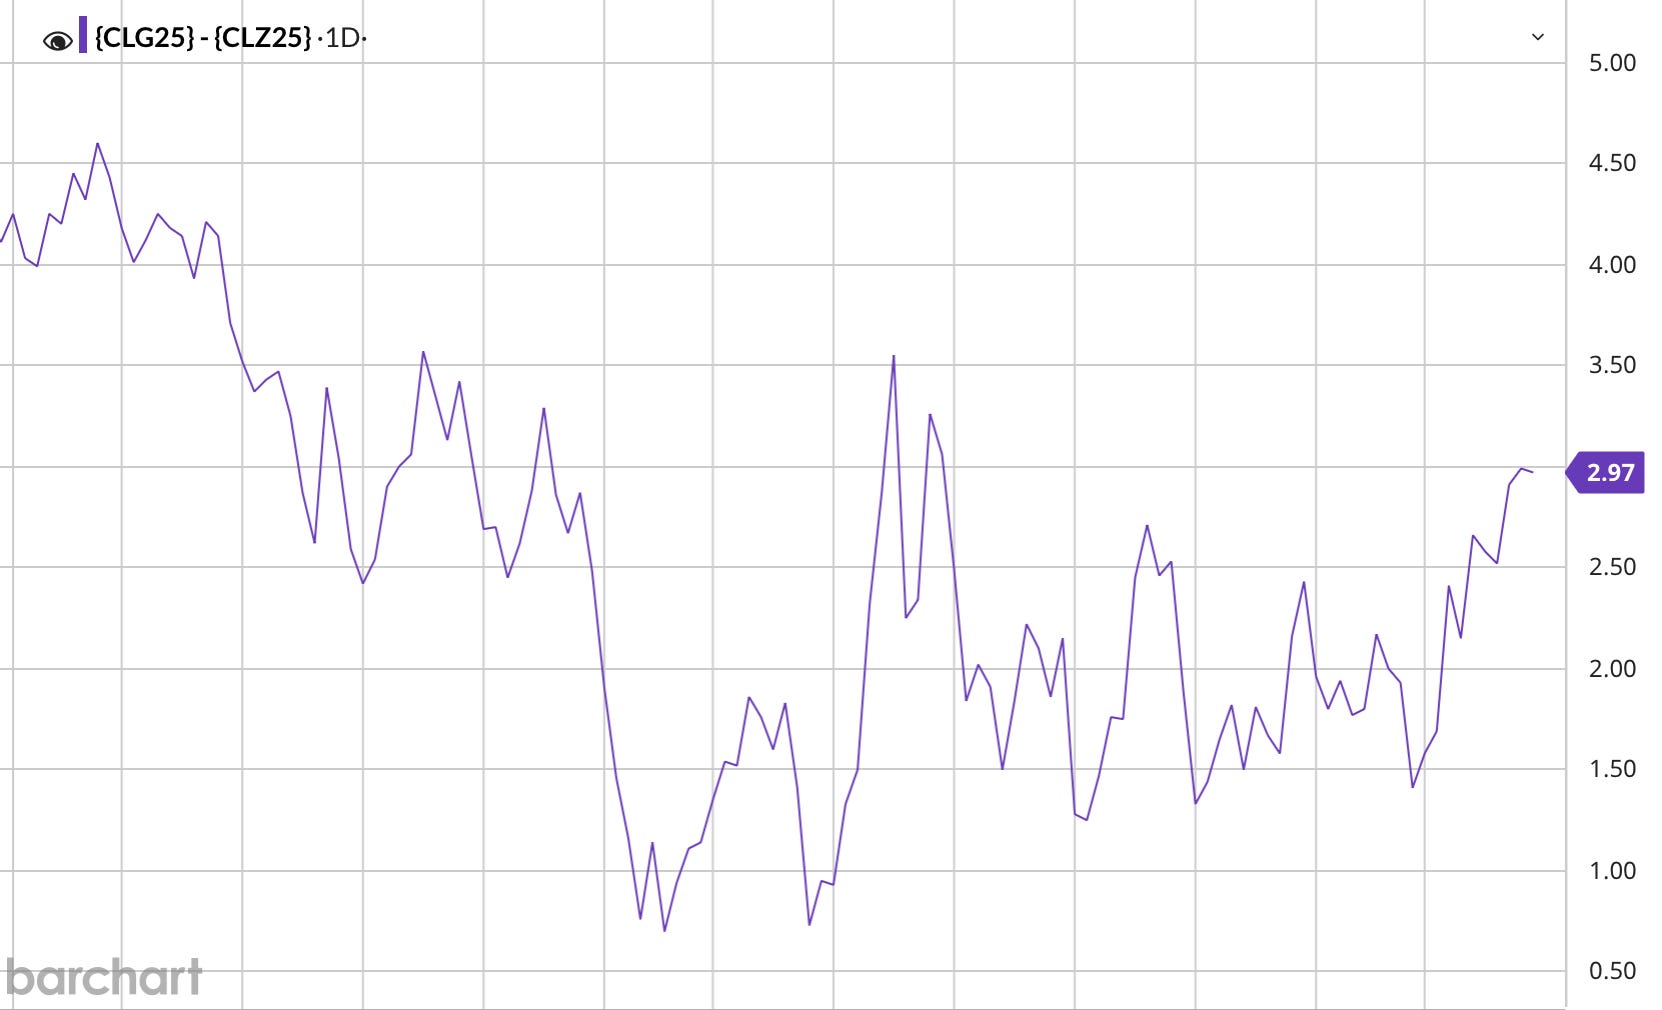
Both time spreads are in backwardation (meaning that spot prices are above futures, indicating strong demand) which is contrary to what one would expect if markets were to be oversupplied in 2025. Forecasts and predictions from agencies and investment banks are interesting to read, but nothing comes close to the insights provided by the real physical market. Everything else is noise and distraction. The recent move higher in time spreads is another sign of a market that is stronger than most analysts expect. If the IEA‘s and Morgan Stanley‘s forecasts of an inventory build in the range of 800k to 950k b/d are correct, we would have seen time spreads in deep contago (meaning that spot prices are below futures, indicating low demand) already.
6.1| Positioning By Market Participants
Net positions in Crude Oil (per the COT report) have seen some increase over the past weeks, likely driven by hedging into year end. More interesting developments, however, have been happening in the XLE (S&P Energy Index). As of December 17th, the COT (Commitment Of Traders) report28 has a few interesting findings on the positioning of major players in the market.
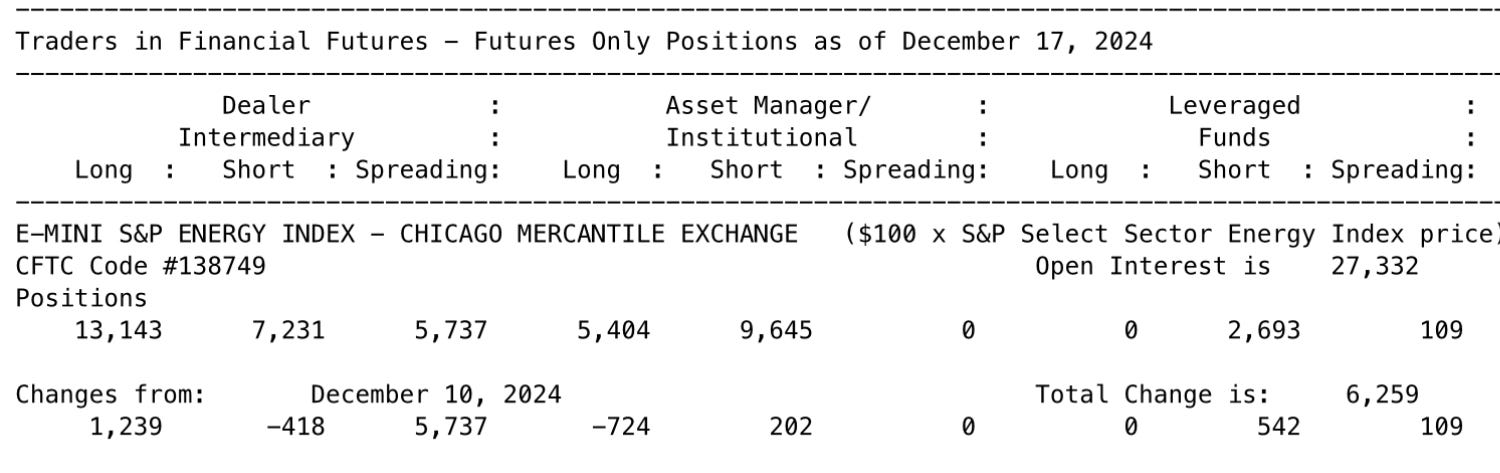
As a quick background, Dealers or intermediaries include institutions like banks that earn profits through spreads, commissions, and arbitrage. They often act as market makers on exchanges. Their role is to facilitate trades and act as middlemen in the market.
As of the latest COT report, dealers are net long the XLE after increasing their longs and reducing their shorts compared to the prior week. Meanwhile, asset managers and institutional investors are net short the market, having reduced their longs and added to their shorts. Leveraged funds don’t have any longs on the index but increased their shorts versus the prior week. It is a battle between asset managers and dealers of a proportion that we haven’t seen since 2020.
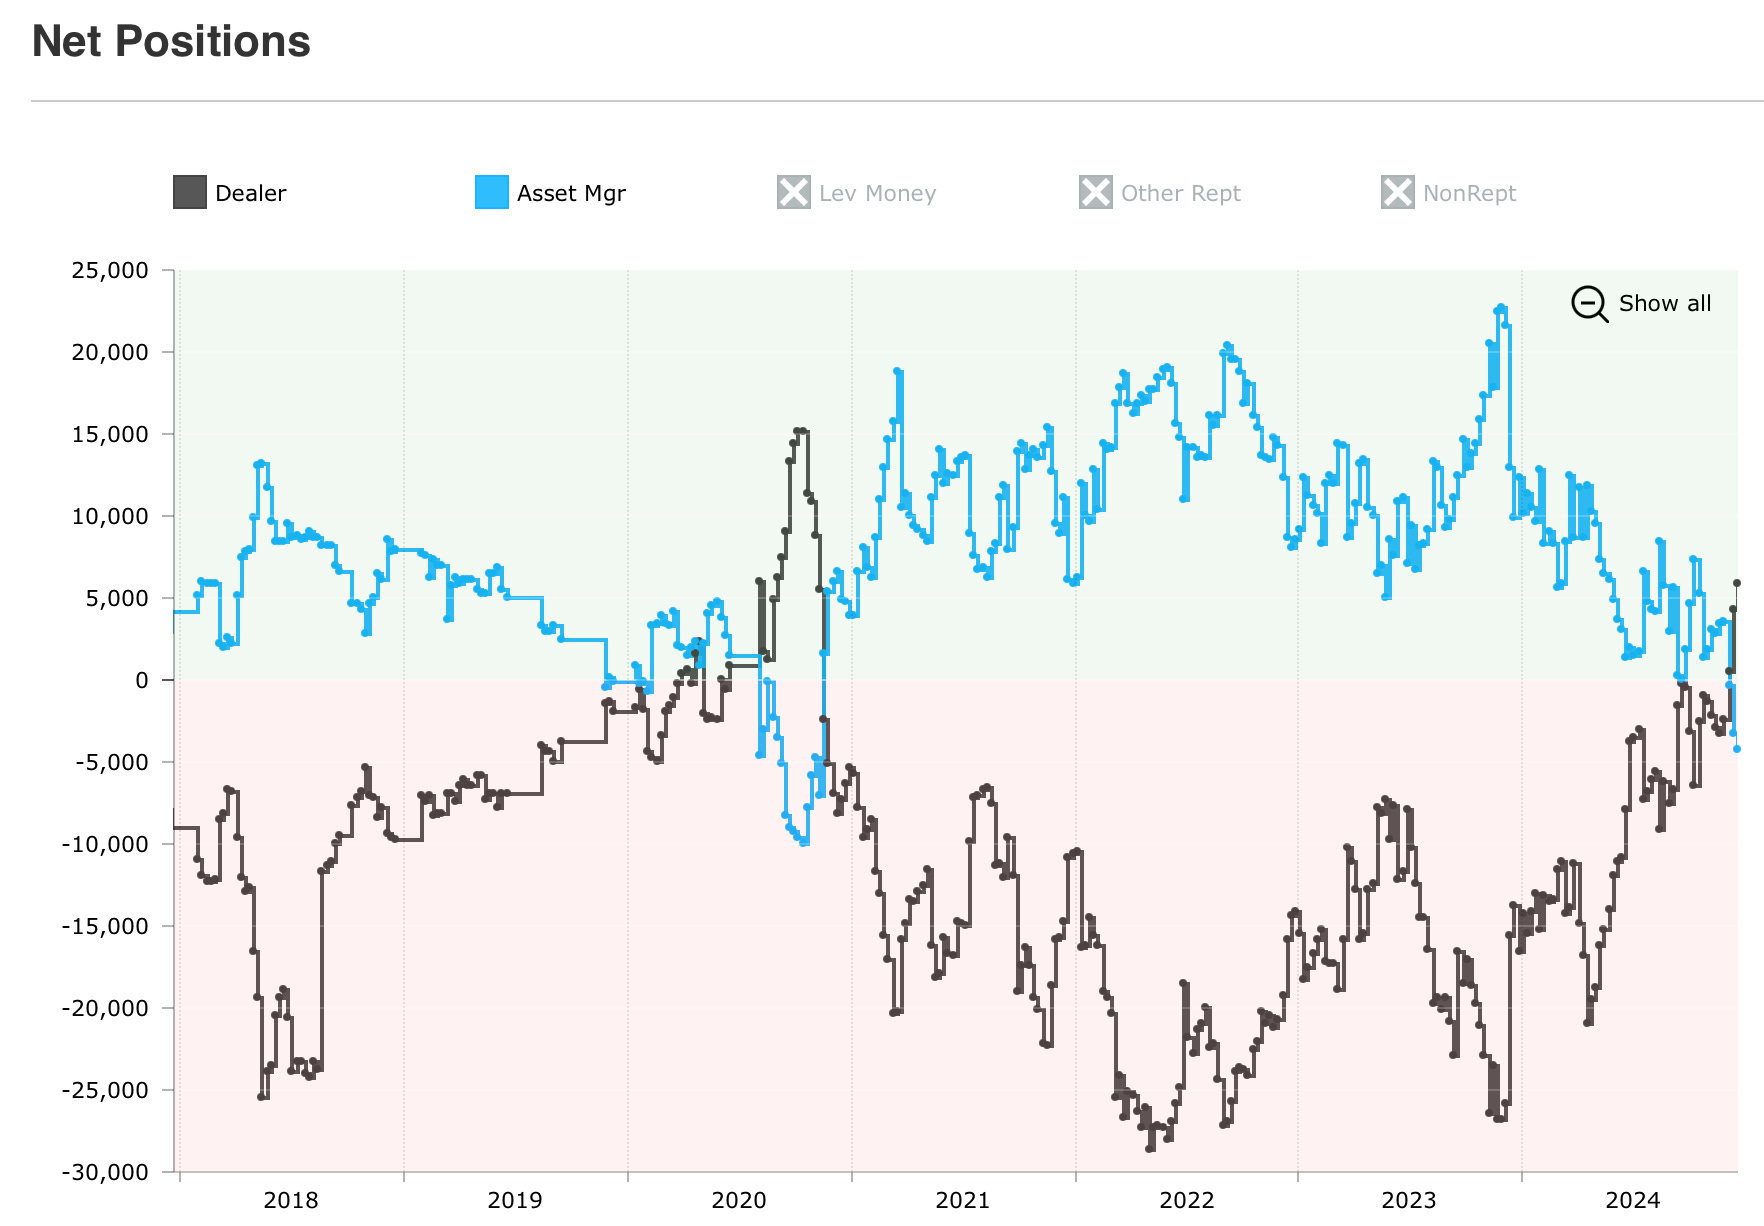
As can be seen from the chart below, dealers increased their long positions on the XLE at an impressive speed, while asset managers reduced the few longs they still had.
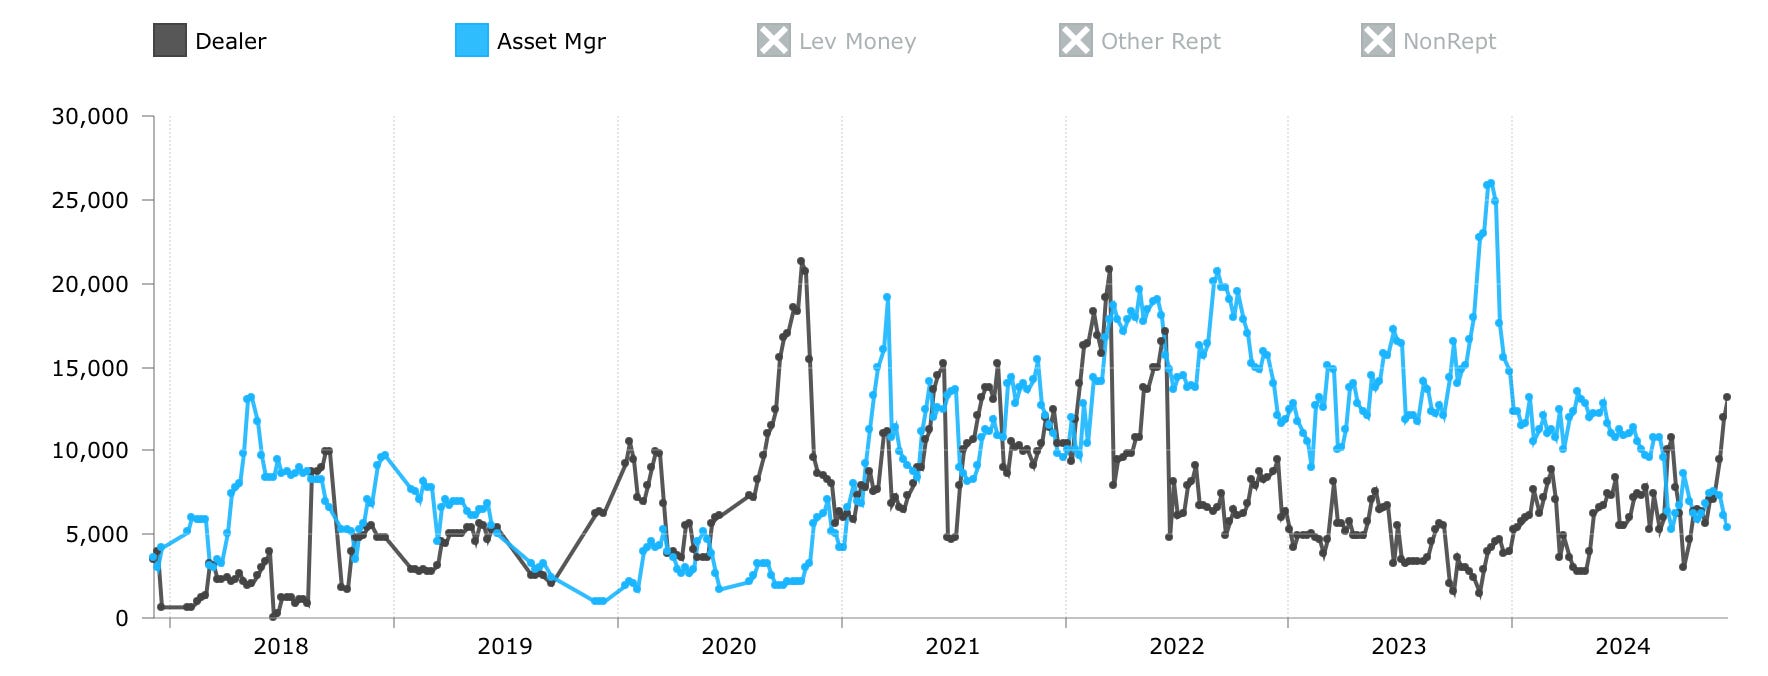
This is a highly unusual development, as dealers are net long for the first time since 2020, while asset managers are net short for the first time since 2020.
7.0| Conclusion And My Positions
In conclusion, there is a lot of noise in the oil market. With narratives and opinions being interpreted either way it’s key to have a look at the data yourself. OPEC+ is as united as ever, Chinese oil demand likely hasn’t peaked yet and non-OPEC supply growth estimates are aggressive heading into 2025. With inventories at multi-year lows and counter-seasonal draws, the fundamentals are better then most analysts expect. The physical market is showing strength and both WTI and Brent are is backwardation, indicating at least a well balanced market. This goes against consensus and the Shale remains a wild card for 2025. It has too be noted that current growth forecasts for the U.S. are based on the assumption of a continuation of prior growth rates. The current market environment doesn’t support these forecasts and the likelihood of disappointing non-OPEC supply growth is higher then most expect.
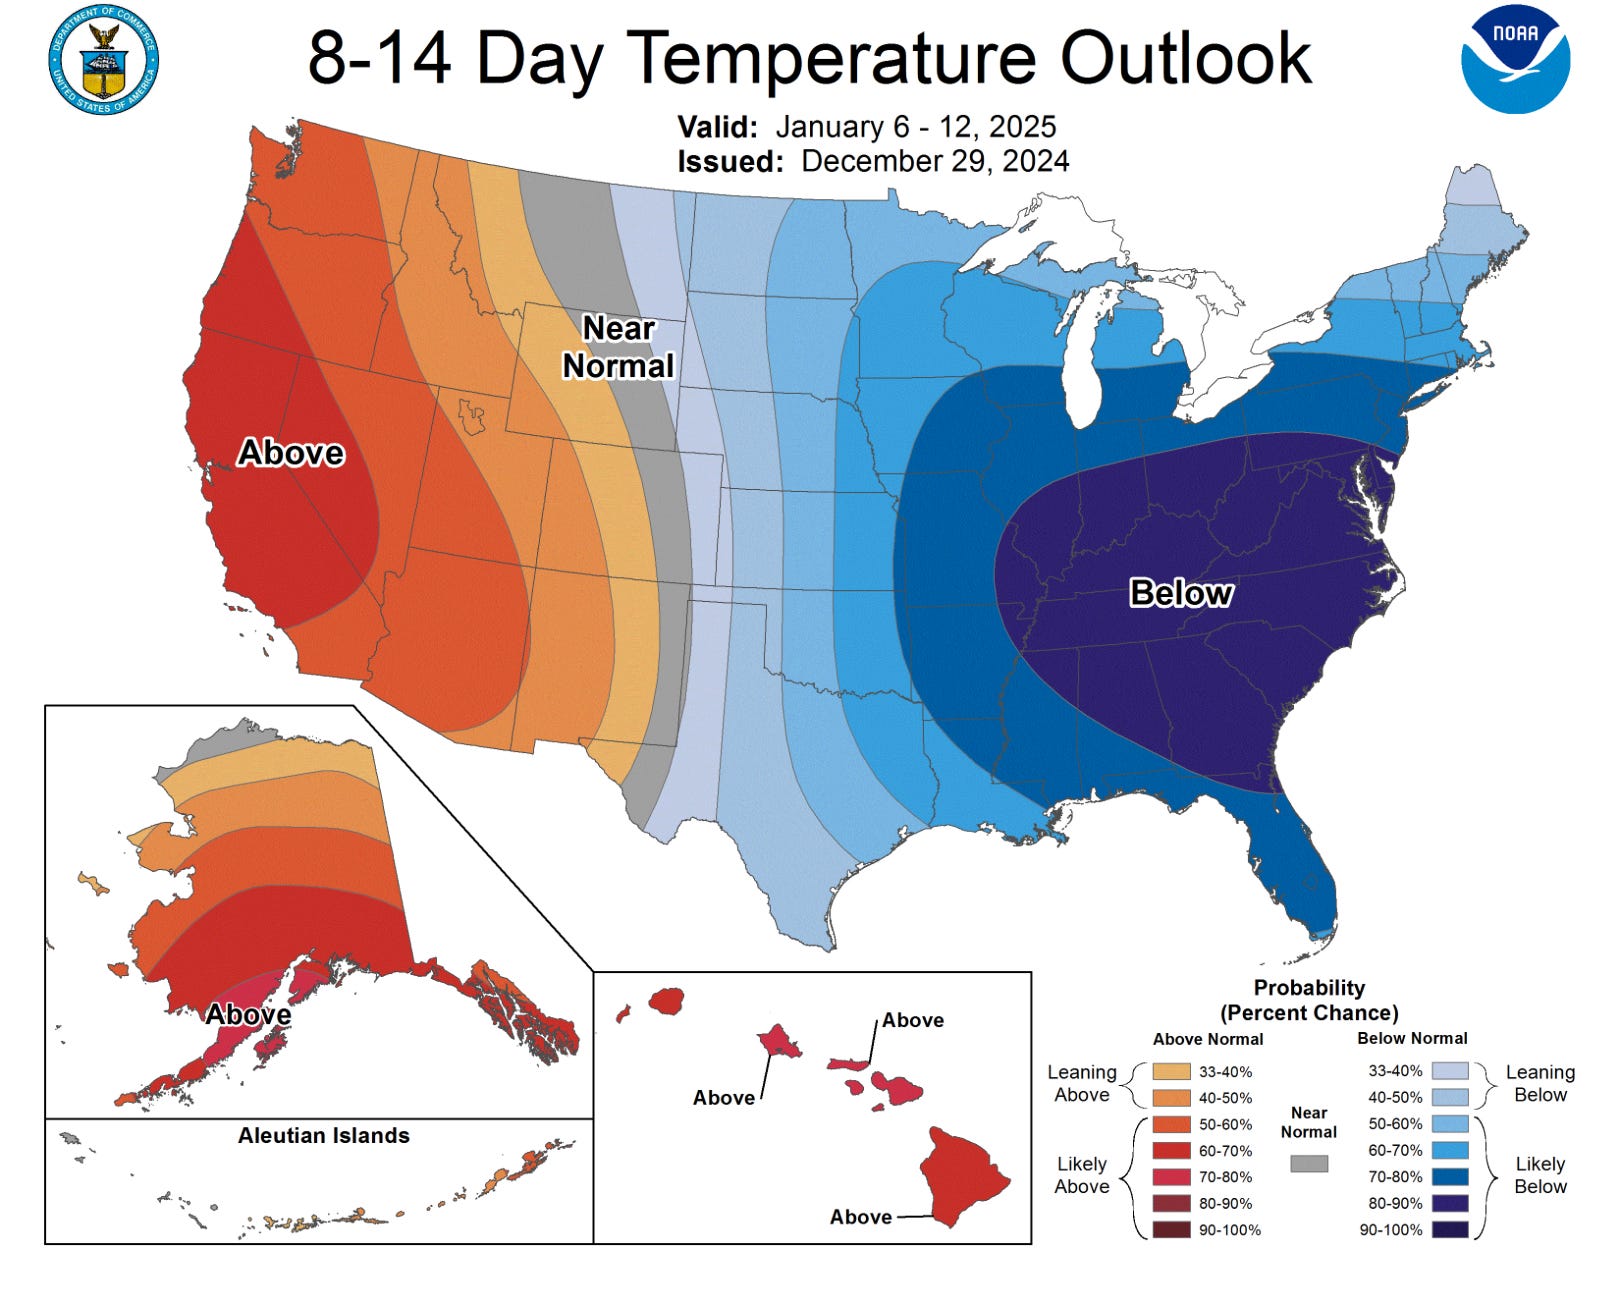
The weather is hard to predict, but if the current forecasts for the U.S. hold true, natural gas prices would move significantly higher. Oil prices would also be positively impacted, as production at several locations would be shut-in due to the extreme cold. I don’t consider this part of the investment thesis, but cold weather has the potential to positively impact the oil price in Q1.29
7.1| My Positions
Moving to stocks, it’s interesting to see dealers and intermediaries switch to net long positions for the first time since 2020. I am bullish on E&Ps heading into 2025, as their valuations don’t reflect my view of the energy markets. With high dividend yields and low valuations, energy stocks offer protection against potential inflationary rebounds and geopolitical instability in the Middle East and Russia. In addition, the sentiment is depressed making for a great contrarian bet into 2025.
My current positions in oil & gas stocks include Vår Energi, GeoPark, Petrobras, Okea Asa and Woodside Energy. The Norwegian E&P Vår Energi is among the largest exports of natural gas to continental Europe and is growing production to 400k boe/d while paying a 13% dividend yield at the peak of it’s CAPEX cycle. Okea Asa is a small E&P from Norway trading at deeply depressed multiples which isn’t justified by the recent operational performance of the company.
Petrobras is amongst the largest E&Ps on the planet, holding a large resource base with low breakevens. Due to the integrated business model, the company is very competitive and is generating ~$20 billion in FCF. Petrobras is trading at low multiples and a 13-17% dividend yield because of the fact that the company is controlled by the Brazilian state. I agree that the stock deserves to trade at a discount compared to American majors such as Exxon, but the discount is too large and fears over nationalization haven’t materialized. I hold a small position in Woodside Energy, one of the world’s largest LNG producers, headquartered in Australia. The company is expanding through M&A and offers a dividend yield of around 9%.
Lastly, I hold GeoPark, a small Colombian E&P focused on LATAM. The company’s management team has a strong track record of generating value through acquisitions, and has recently been expanding into Argentina. With a 6.5% dividend yield, growth and a depressed valuation due to pessimism towards Colombia, 2025 looks bright for GeoPark. In 2026, current president Petro will be out of office and Colombia may attracted more capital from investors, as the country’s stock market is amongst the cheapest globally. I have sold half of my position in the stock at $11.25 and repurchased it at $8.58.30
I wish everyone a great year ahead and may 2025 be the year of energy and value.
Yours sincerely,
MODERN INVESTING
Wow. What a bunch of information. Thanks.
Phenomenal research. Top shelf, mate. Cheers John.